We leverage the latest advancements in Data, Analytics, Artificial intelligence, and Cloud technologies to help companies gain actionable insights and drive positive business outcomes.
Business intelligence
We help businesses make data-driven decisions by providing them with the tools and insights they need to succeed
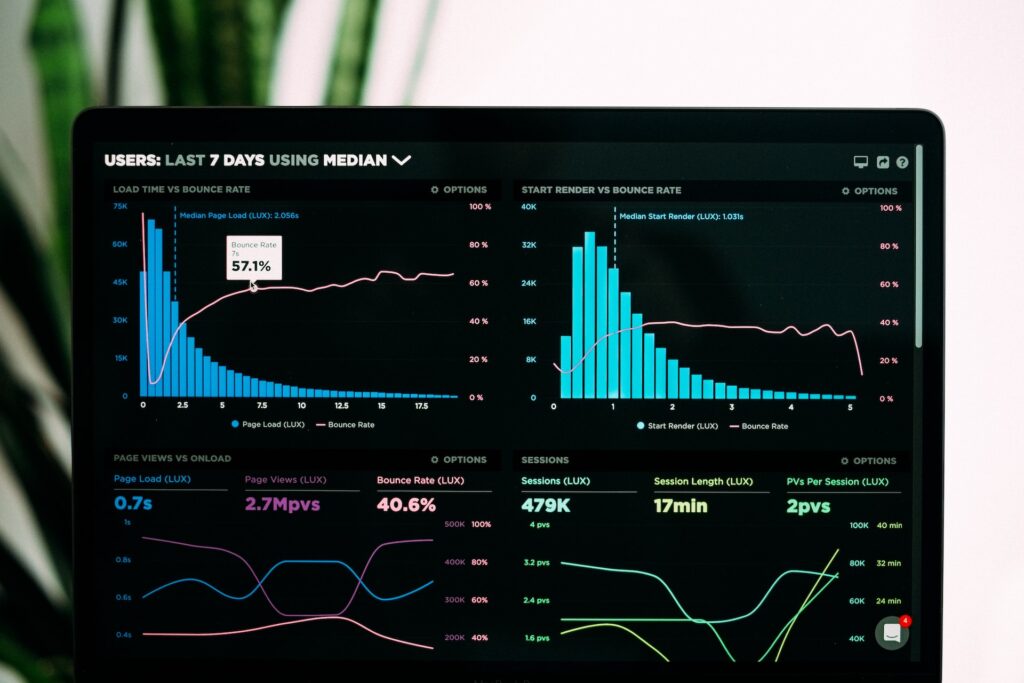
With our BI solutions, we empower your business to make data-driven decisions. We create interactive dashboards and reports that offer actionable insights, enabling you to monitor KPIs, track performance, and optimize operations effectively.
Data Integration and Consolidation
BI involves gathering data from various sources across the organization, such as transactional databases, customer relationship management (CRM) systems, enterprise resource planning (ERP) systems, spreadsheets, and external data sources. This data is integrated and consolidated into a central repository or data warehouse, enabling comprehensive analysis and reporting.
Data Modeling and Transformation
Once the data is consolidated, BI professionals apply data modeling techniques to structure and organize the data in a way that supports efficient analysis. Data transformation processes may include cleaning and filtering the data, standardizing formats, resolving inconsistencies, and creating calculated fields or metrics.
Data Modeling and Transformation
Data Analysis and Exploration
BI tools provide capabilities for data analysis and exploration, allowing users to interact with data and uncover meaningful patterns, trends, and relationships. Users can perform ad-hoc queries, slice-and-dice data, apply filters, and drill down into detailed information to gain insights into business performance and identify areas for improvement.
Reporting and Dashboards
BI platforms enable the creation of interactive reports and dashboards that present key performance indicators (KPIs) and metrics in a visual and easily digestible format. These reports and dashboards provide real-time or near-real-time visibility into business performance, allowing stakeholders to monitor progress, track goals, and make data-driven decisions.
Reporting and Dashboards
Data Visualization
Visualizing data is an essential aspect of BI, as it helps communicate complex information in a clear and understandable manner. BI tools offer a range of visualization options, such as charts, graphs, heatmaps, maps, and infographics, to represent data visually and facilitate quick comprehension and interpretation.
Data Mining and Predictive Analytics
BI can go beyond descriptive analysis and employ data mining and predictive analytics techniques to identify hidden patterns, make forecasts, and support proactive decision-making. These techniques use statistical algorithms, machine learning models, and data exploration to uncover insights, predict future outcomes, and prescribe optimal actions.


