Navigating the swift currents of the modern business landscape demands a keen ability to extract meaningful insights from raw data. Picture this endeavor as an artist meticulously shaping a masterpiece, with the canvas being a finely crafted analytics dashboard. This blog serves as your trusted companion on this transformative journey, offering insights into the essential steps of the process. We’ll also shed light on how Techmax Technologies can elevate this experience, turning your data into a formidable asset that fuels your business strategy. The aim is to simplify data analytics, so it’s easy and helpful for businesses of any size. Picture working together with advanced technology to uncover the full power of your data.
Unveiling the Power of Analytics Dashboards
In the world of transforming raw data into actionable insights, understanding your data landscape becomes the cornerstone. Before delving into the creation of an analytics dashboard, a meticulous analysis of your data sources initiates the process, ensuring a holistic view and laying a robust foundation for insightful analytics.
Understanding Your Data Landscape
A thorough exploration of your data landscape involves delving into diverse sources to gain a comprehensive understanding. This holistic approach lays the foundation for crafting an analytics dashboard that captures the essence of your data ecosystem.
Defining Clear Objectives and Key Metrics
Crafting an impactful analytics dashboard requires teamwork. Close collaboration with your team to set clear objectives and identify key metrics ensures the dashboard is purpose-built to provide actionable insights. By understanding your unique business goals, the dashboard is tailored to empower decision-makers with precise, relevant information.
Choosing the Right Data Visualization Techniques
At the core of every analytics dashboard is visual clarity. Advanced data visualization techniques breathe life into your data, carefully selecting charts, graphs, and interactive elements to ensure the visual representation aligns seamlessly with your business context. This guarantees that intricate data is presented in an easily understandable and meaningful way.
Ensuring Data Accuracy and Quality
Data integrity is crucial for meaningful insights. Implementing stringent data validation processes ensures accuracy and reliability, forming the foundation of actionable insights. Upholding high data quality standards guarantees that decisions are grounded in trustworthy information.
Creating an Intuitive User Interface
User experience takes center stage in analytics dashboard design. Prioritizing an intuitive interface for seamless navigation through your data landscape, this user-centric approach boosts engagement and usability, maximizing the dashboard’s impact. Crafting a user-friendly and visually compelling interface enhances the overall effectiveness of the dashboard.

How Techmax Technologies Takes Your Dashboard to the Next Level
Techmax Technologies stands out in elevating your analytics dashboard experience through a suite of specialized services tailored to meet the unique demands of your business.
Tailored Solutions for Your Business
Techmax Technologies values the uniqueness of each business, taking a collaborative approach to offer customized solutions. Whether you’re in finance, healthcare, or e-commerce, our expertise ensures a finely tuned dashboard that aligns with your industry’s specific needs. This tailored approach ensures that the analytics dashboard becomes a customized tool, precisely crafted to meet your business goals.
Advanced Data Integration Capabilities
Creating a dashboard can be tricky because it involves bringing together different types of information. We use advanced techniques to smoothly combine various data sources, giving you a complete and detailed view in one place. This comprehensive approach ensures that your analytics dashboard paints a full picture of your business, helping you make better decisions.
State-of-the-Art Visualization Techniques
At Techmax Technologies, we stay updated with the latest ways of showing data. We use cool techniques to make your analytics dashboard look amazing. This means you get a visual experience that goes beyond the usual charts and graphs. We use interesting visuals and interactive elements to make even complicated information easy to understand. So, your insights aren’t just informative, they’re also interesting and easy to grasp.
Robust Data Security Measures
Keeping your data safe is really important to us. We make sure to put strong security measures in place to protect your information. This way, when you use our analytics dashboard, you not only get valuable insights, but you can also trust that your data is secure. We’re committed to keeping your information safe, so you can confidently use your dashboard without worrying about security.
Continuous Support and Optimization
Our teamwork with Techmax Technologies goes beyond just setting things up. They’re committed to making sure you succeed by providing ongoing support and making improvements. As your business grows and changes, your analytics dashboard gets better too.
Techmax’s All Leads Dashboard: Precision in Lead Analytics
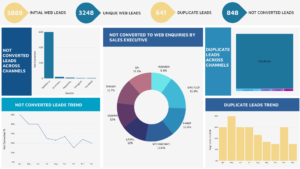
Consider our exemplary All Leads Dashboard, a testament to Techmax Technologies’ commitment to comprehensive analytics. This dashboard meticulously tracks key metrics such as Initial Web Leads, Unique Web Leads, Duplicate Leads, and Not Converted Leads. This granular approach empowers businesses to dissect and interpret lead data, providing valuable insights into trends, conversions, and areas for optimization. The All Leads Dashboard exemplifies our dedication to delivering precise, actionable data that fuels strategic decision-making in the dynamic landscape of lead management.
In the dynamic realm where data meets narratives, Techmax Technologies emerges as the ally transforming numbers into actionable insights. Our journey navigated the intricacies of crafting analytics dashboards, emphasizing understanding data landscapes, defining objectives, employing visualization techniques, ensuring data accuracy, and creating user-friendly interfaces. Techmax takes this experience to the next level with tailored solutions, advanced data integration, state-of-the-art visualization, robust security, and continuous support. Illustrated through the All Leads Dashboard, our commitment to precision in lead analytics showcases the power of data at your fingertips. We simplify the complexities, making data analytics accessible and valuable for businesses of all sizes, a collaboration where your data transforms into a strategic asset.