Data Visualization for Informed Decision-Making

Visualizing data is the cornerstone of unlocking valuable and actionable insights from intricate information. In today’s data-rich landscape, dealing with raw data can be overwhelming and challenging to interpret. This is where Techmax Technologies stands out as your trusted ally. We recognize that the art of data visualization goes beyond crafting appealing charts and graphs; it’s about revealing the narratives concealed within the data. Our team of experts at Techmax specializes in crafting and implementing solutions that enable businesses to make well-informed decisions. By utilizing interactive dashboards and visual representations, we assist our clients in identifying patterns, recognizing opportunities, and uncovering essential insights that steer strategic growth. Whether it’s streamlining operations, enhancing customer engagement, or optimizing ROI, Techmax Technologies is here to harness the genuine potential of data visualization for your business triumph.

The Importance of Data Visualization 

In our modern, data-centric environment, information serves as the driving force behind decision-making, and the ability to illustrate this information is the essential element for unlocking its full potential. However, what makes the visual representation of information so crucial in today’s corporate sphere?

1. Simplifying Complexity 

We live in an era where data is continuously generated from various sources at an unprecedented pace. Large and complex datasets have become the norm rather than the exception. While these datasets contain valuable insights, they can also be overwhelming and difficult to decipher in their raw form. Data visualization steps in to simplify this complexity by translating intricate data into clear and understandable visual representations. These visuals allow decision-makers at all levels of an organization to grasp complex information quickly and make informed choices. 

2. Enhancing Comprehension 

Humans are inherently visual creatures. We process visual information much faster and more effectively than plain text or numbers. Data visualization leverages this innate ability, making it easier for individuals to comprehend data patterns, trends, and relationships. It transforms abstract data points into meaningful insights, enabling teams to collaborate effectively and align their efforts toward common goals. 

3. Facilitating Communication 

Data visualization serves as a universal language that transcends barriers. Whether you’re discussing financial metrics, marketing performance, or operational efficiency, visuals provide a common ground for communication. Charts, graphs, and interactive dashboards allow teams to present their findings coherently to stakeholders, fostering a shared understanding of the data and its implications. 

4. Supporting Informed Decision-Making 

In today’s fast-paced business environment, making informed decisions is paramount. Data visualization empowers decision-makers to analyze data quickly, identify trends, and respond to opportunities or challenges promptly. It guides organizations away from gut-based decisions towards evidence-based strategies, reducing risks and increasing the likelihood of success. 

5. Competitive Advantage 

Finally, data visualization isn’t just about keeping up with the competition; it’s about staying ahead. Businesses that harness the power of visualizing information gain a competitive edge by spotting emerging trends, optimizing processes, and adapting to changing market dynamics more swiftly. 
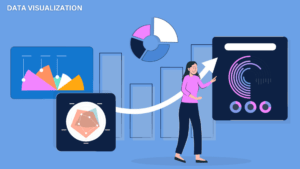
Data Visualization turns numbers into insights and complexity into clarity.

The Role of Data Visualization 

Data visualization is much more than a visual treat; it’s the bridge that transforms raw data into meaningful insights, empowering individuals and organizations to make informed decisions. 

Translating Complexity into Clarity 

One of the most significant challenges in the data-driven landscape is the sheer volume and complexity of information at our disposal. Raw data, often presented in spreadsheets or databases, can be overwhelming. It’s a sea of numbers, dates, and figures that can confound rather than clarify. This is where data visualization plays a pivotal role. 

Through a combination of charts, graphs, heatmaps, and interactive dashboards, data visualization simplifies complexity. It distills intricate data sets into intuitive visual representations that anyone can understand. Patterns emerge, trends become apparent, and relationships are revealed. What was once a maze of data points is now a clear and navigable map, guiding decision-makers to their destination—actionable insights. 

Beyond Aesthetics: Transforming Data into Insights 

While aesthetically pleasing visuals are undoubtedly appealing, data visualization goes far beyond mere surface beauty. It’s about the substance within—the story the data tells. The true power of data visualization lies in its ability to turn data into insights that drive meaningful actions. 

Through thoughtful design and strategic selection of visualization methods, data visualization unlocks the latent value within data. It answers critical questions, such as “What are our top-selling products?” or “Which marketing channel is most effective?” It enables decision-makers to delve deeper, asking “Why are sales declining in this region?” or “What factors are driving customer churn?” 

By providing these answers, data visualization empowers organizations to identify opportunities, mitigate risks, and optimize their strategies. It transforms data from a passive resource into an active agent of change, driving improvements in operations, marketing, finance, and more. 

In essence, data visualization is the catalyst for informed decision-making. It empowers individuals and teams to navigate the vast sea of data, extract meaningful insights, and steer their organizations toward success. As we delve deeper into the world of data visualization, we’ll explore how Techmax Technologies leverages these principles to create data-driven solutions that empower businesses to thrive in an increasingly complex and data-rich environment. 

Techmax Technologies: Transforming Businesses through Data Visualization 

At Techmax Technologies, we are not just in the business of data visualization; we are in the business of transformation. Our mission is to harness the immense power of data visualization to revolutionize the way businesses operate, make decisions, and thrive in today’s data-centric landscape. 

Customized Solutions for Unique Challenges 

We recognize that each business is as unique as the data it generates. That’s why we don’t offer one-size-fits-all solutions. Our approach is rooted in collaboration and customization. We work closely with our clients to understand their specific challenges, objectives, and industry nuances. Armed with this knowledge, we design data visualization solutions that are tailor-made to address their unique needs. 

From Raw Data to Strategic Insights 

Our team of data visualization experts possesses a deep understanding of the intricacies of data. We excel in transforming raw, complex data into clear, insightful visual representations. Our interactive dashboards are more than just aesthetically pleasing; they are intuitive tools that empower decision-makers to explore data, identify trends, and gain actionable insights. 

Driving Growth, Enhancing Efficiency 

Techmax Technologies isn’t just about making data look good; it’s about making data work for you. Our solutions go beyond surface-level improvements; they drive growth, enhance efficiency, and elevate performance. Whether it’s optimizing operations, enhancing customer engagement, or improving ROI, our data visualization solutions have a tangible impact on your bottom line. 

The Finance 360 Success Story 

One prime example of our transformative approach is the Finance 360 dashboard. This dynamic and intuitive platform provides real-time insights into critical financial metrics, offering decision-makers unprecedented clarity into their financial health. Net Sales, Cost of Sales, Gross Profit, Total Income, Operating Profit, Net Profit—every crucial financial aspect is at your fingertips. With customizable Net Sales By Brand and Net Sales By Source Channel visuals, identifying top-performing segments has never been easier. The P & L Funnel offers an eagle-eye view of profit and loss trends while Operating Profit By Year and Gross Profit By Year charts enable historical performance analysis. The Inventory Turnover By Month and Debtors Turnover By Month visuals provide invaluable insights into inventory and receivables management. The Finance 360 dashboard is a testament to our commitment to delivering real, measurable results. 
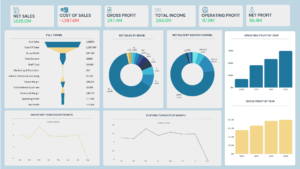
Finance Dashboard

In essence, Techmax Technologies isn’t just a data visualization provider; we are your partner in transformation. We are committed to helping businesses navigate the complexities of the data-driven era and emerge not just informed but empowered. As we journey further into the world of data visualization, you’ll discover how Techmax Technologies continues to shape the future of business success through the power of data. 

Share

Related Articles

Uncategorized
Joana

The Loyalty Multiplier: Leveraging Customer Experience Analytics to Drive Long-Term Customer Retention

Retaining consumers has become just as crucial as getting new ones in today’s competitive industry. In addition to being a reliable source of income, loyal consumers promote the brand and attract new clients by word-of-mouth.   The question arises on how can companies effectively foster this loyalty.   Utilizing customer experience (CX) data and analytics to better understand and optimize the elements that influence client loyalty is the key to the solution.   Understanding Customer Experience Data and Analytics  Customer experience analytics involves collecting and analyzing data about every interaction a customer has with a brand. Numerous sources, including consumer surveys, social media, website interactions, past purchases, and customer service encounters, can provide this data. Businesses can learn about consumer preferences, habits, and pain points by examining this data.   Analytics on customer retention are essential for growing your business. You can reduce churn by examining data regarding your company’s client retention.   Also read: Churn Analysis: Keeping Customers Engaged with Data Insights   Data analytics is essential for retaining customers as it offers useful insights that organizations can use to better understand and enhance the customer experience. Here are a few main advantages:  Predictive Insights: Organizations can forecast consumer trends and behavior by using data analytics. Companies can prevent customer turnover by anticipating future demands and proactively addressing prospective concerns by finding patterns in consumer data.   Personalization: Companies can craft incredibly tailored experiences by analyzing consumer data. Because they feel appreciated and understood, clients are more satisfied and loyal when this level of customization is provided.     Targeted Analytics: It is used in targeted marketing to segment clients according to their preferences and behaviors. As a result, marketing campaigns can be targeted more precisely, resulting in the correct messages reaching the right people.    Identifying At-Risk Customers: Companies can determine which customers are most likely to leave by looking at customer interactions and behaviors. Timely intervention strategies to re-engage these clients are made possible by early identification.    Improved customer service: Data analytics can identify frequent problems and opportunities for better customer service. This makes it possible for companies to improve the support services they offer, which raises customer happiness and retention.    Measuring Impact: Analytics provide instruments for measuring how well customer retention strategies are working. Businesses can optimize retention by continuously refining their tactics through the monitoring of key performance indicators (KPIs).    Using Analytics and Data to Measure Success    It’s critical to use data and analytics to regularly track and assess the impact of your tactics on customer loyalty to make sure they are working. To monitor, these are the following key performance indicators (KPIs):  Customer retention rate: The proportion of clients that stick with you over an extended period is known as your customer retention rate.    Customer Lifetime Value (CLV): The entire amount of money a company can anticipate making from a single client over the course of that client relationship.    Net Promoter Score (NPS): Indicates the likelihood that consumers will tell others about your brand.    Customer Satisfaction Score (CSAT): A measure of how satisfied customers are with your products or services.      By regularly monitoring these KPIs with data and analytics, businesses can adjust their strategies as needed to ensure they are effectively driving customer loyalty. Techmax analytics dashboard helps companies maximize their data stack to improve sales and overall performance.     Conclusion  Analytics and statistics on the customer experience are important instruments in the long-term client retention game. Businesses can create enduring relationships with their consumers by comprehending the primary factors that influence customer loyalty and putting specific plans into place to improve these areas. The result is a devoted clientele that generates income and aids in drawing in new business via favorable word-of-mouth.  

Read More
Data Analysis
Devapriya

Beyond Clicks: Navigating the Future of Data-Infused Entertainment Advertising

In today’s rapidly evolving entertainment landscape, the key to capturing audience attention and maximizing Return on Investment (ROI) lies in the strategic implementation of data-driven advertising. This blog post explores the profound impact of data analytics on targeted advertising for movies, TV shows, and various entertainment content, shedding light on how it transforms the advertising landscape and elevates the overall success of campaigns.  The Power of Data Analytics in Entertainment Advertising 1. Precision Targeting for Maximum Impact:  In the ever-evolving landscape of entertainment, the success of advertising campaigns hinges on the ability to truly understand audience preferences. Data analytics serves as the compass guiding advertisers through the vast sea of consumer behavior. By harnessing intricate patterns and trends, advertisers can pinpoint specific demographics with unparalleled precision. This level of insight empowers them to tailor their messaging and creative elements to resonate with the exact interests and preferences of their target audience. The result is not just engagement but a resonance that forms the foundation for highly effective and impactful campaigns.  2. Tailoring Content to Viewer Preferences:  Data analytics acts as the decoder for the intricate language of viewer behavior and preferences. Advertisers, armed with this valuable information, embark on a journey to craft content that transcends generic messaging. Dive deep into how this process unfolds, exploring the methodologies that advertisers employ to transform raw data into actionable insights. The ability to decipher what resonates with viewers on an individual level allows for the creation of highly personalized and compelling advertisements. This personalized touch not only captures attention but also forges a connection that transcends the traditional advertiser-consumer dynamic. 3. Optimizing Ad Placement across Platforms: The entertainment industry is inherently cross-platform, presenting both opportunities and challenges for advertisers. Delve into the complexities of choosing the right channels to ensure that promotional content doesn’t just reach audiences but resonates effectively. Data analytics acts as a strategic ally in this endeavor, providing insights into viewer habits across various platforms. This section explores how advertisers leverage these insights to optimize ad placement, strategically positioning their content where it will have the most significant impact. From social media platforms to streaming services, understanding the nuances of each channel ensures that promotional efforts align seamlessly with audience behaviors, capturing attention precisely when and where it matters most.  Enhancing ROI through Data-Driven Strategies  4. Measuring Campaign Success with Analytics:  In the dynamic landscape of data-driven advertising, the ability to measure campaign success is crucial for advertisers seeking to optimize their strategies. Explore the various metrics and Key Performance Indicators (KPIs) that serve as the pulse of a campaign’s performance. Delve into metrics such as click-through rates, conversion rates, and engagement metrics to understand how each contributes to the overarching success of an advertising initiative. Furthermore, explores how data analytics empowers advertisers with real-time insights, allowing them to monitor and evaluate campaign performance on the fly. This real-time feedback loop enables quick adjustments and optimizations, ensuring that the campaign adapts to changing audience behaviors, emerging trends, and unexpected challenges, ultimately maximizing impact and Return on Investment (ROI). 5. Predictive Analytics for Box Office Hits: The film industry is undergoing a profound transformation with the integration of predictive analytics. Explore the methodologies behind predictive analytics and its pivotal role in forecasting box office success. Uncover how data analytics models analyze historical data, audience behaviors, and market trends to make informed predictions about a movie’s potential performance. This section takes a closer look at the impact of predictive analytics on shaping production and marketing strategies. From greenlighting projects to allocating marketing budgets strategically, predictive analytics is becoming a cornerstone in decision-making for film studios. By understanding the intricacies of predictive modeling, readers gain insights into how the film industry is leveraging data analytics to mitigate risks and increase the likelihood of box office triumphs. 6. The Role of AI in Personalized Ad Experiences: Artificial Intelligence (AI) is revolutionizing the way advertisers create personalized ad experiences. Explore the integration of AI algorithms into the advertising landscape, dissecting how these algorithms analyze vast datasets to understand individual preferences. Highlight specific AI-driven technologies, such as recommendation engines and dynamic content generation, that tailor advertisements on a granular level. This section delves into the psychology behind personalized experiences, explaining how AI not only predicts preferences but adapts in real time based on user interactions. By delivering content that aligns with individual tastes and behaviors, AI-driven personalized ad experiences significantly increase audience engagement. This exploration provides a deep understanding of how AI is reshaping the advertising narrative, creating more meaningful connections between brands and consumers in the entertainment industry.   Challenges and Future Trends 7. Ethical Considerations in Data-Driven Advertising:  In the era of data-driven advertising, it’s imperative to shine a light on the ethical considerations that accompany the collection and utilization of user data in the entertainment industry. Acknowledge the concerns surrounding privacy, consent, and the responsible handling of sensitive information. Delve into the importance of transparency in communication between advertisers and consumers. Discuss how maintaining an open dialogue about data practices builds trust and contributes to a positive advertiser-consumer relationship. By exploring the ethical dimensions of data-driven advertising, this section aims to raise awareness about the potential impact on user trust and satisfaction, ultimately emphasizing the importance of ethical practices in safeguarding the integrity of the industry. 8. Emerging Trends in Entertainment Advertising Analytics: Explore the latest trends and innovations in data analytics for entertainment advertising. From immersive technologies to interactive campaigns, discover how advertisers are staying ahead of the curve.  In conclusion, the transformative power of data analytics in entertainment advertising is undeniable, reshaping the industry’s landscape and elevating the success of campaigns. Precision targeting, personalized content creation, and strategic ad placement across platforms have become essential components of effective advertising strategies. The ability to measure campaign success in real time and the integration of predictive analytics for box office hits underscore the dynamic nature of data-driven approaches. The infusion of AI further amplifies personalized ad experiences, fostering meaningful connections between brands

Read More
Data Analysis
Devapriya

Strategic Crisis Response: How Data Analytics in Aviation Ensures Resilience

In the dynamic and unpredictable world of aviation, crises can strike at any time—be it natural disasters, pandemics, or geopolitical issues. The ability to respond swiftly and effectively is crucial for the survival of airlines. In this blog post, we will explore how the aviation industry leverages data analytics to proactively manage crises, maintain business continuity, and enhance overall resilience.  Understanding the Landscape  1. Predictive Analytics in Crisis Preparedness:  Purpose: Airlines use predictive analytics to forecast and model potential crisis situations before they occur. This proactive approach allows them to be better prepared and respond more effectively to mitigate potential damages.  Data Sources: Analysis involves historical data, weather patterns, and geopolitical trends. Historical data might include information on previous disruptions, flight delays, or cancellations, while weather patterns and geopolitical trends help anticipate potential challenges in various regions.  Predictive Models: Through the use of sophisticated predictive models, airlines can identify patterns and trends that may indicate the likelihood of a crisis. These models may consider factors such as past incidents, weather-related risks, and geopolitical tensions.  Early Detection and Planning: The goal is to detect potential crises early on, allowing airlines to implement strategic plans to minimize disruptions. For instance, if historical data indicates that certain routes are prone to weather-related issues during a specific season, airlines can proactively adjust schedules or routes.  2. Real-time Data for Rapid Response:  Continuous Monitoring: Airlines constantly monitor a variety of data streams in real time, including flight data, passenger information, and global events. This involves using advanced technology and systems to keep a constant eye on relevant information.  Timely Decision-Making: Real time data analytics empowers airlines to make prompt and informed decisions during emergencies. For instance, if there’s an unexpected event affecting a specific region, airlines can quickly assess the situation and make adjustments to flights or operations to ensure passenger safety and minimize disruptions.  Adaptive Strategies: The ability to access and analyze data in real time allows airlines to adapt their strategies on the fly. For example, if there’s a sudden surge in passenger demand due to an unforeseen circumstance, airlines can adjust ticket prices, allocate resources accordingly, or implement other measures to meet the demand.  Enhanced Communication: Real-time data also supports effective communication with passengers and relevant authorities. Airlines can provide timely updates, alternative travel options, and safety instructions based on the most current information available.     Crisis Management in Action  3. Natural Disasters: Mitigating the Impact:  Case Studies:  Hurricanes: Airlines use historical weather data and predictive models to anticipate the path and impact of hurricanes. This enables them to proactively reroute flights, evacuate aircraft from affected areas, and adjust crew schedules.  Earthquakes and Volcanic Eruptions: Predictive analytics can help assess the risk of earthquakes or volcanic eruptions in specific regions. Airlines can use this information to plan alternative routes, manage ground operations at airports near affected areas, and ensure passenger safety.  Predictive Models in Action:  Airlines can leverage predictive models to simulate the potential impact of a natural disaster on their operations. This includes assessing the likelihood of airport closures, disruptions to supply chains, and challenges in crew scheduling. The ability to reroute flights based on real-time and predictive data helps minimize disruptions and ensures the safety of passengers and crew.  4. Pandemic Response: Data-Driven Decision Making:  Optimizing Schedules: Data analytics assists airlines in adjusting flight schedules based on factors like travel restrictions, demand fluctuations, and health protocols. This ensures efficient resource allocation and minimizes financial losses.  Assessing Passenger Health Risks: Airlines can use data to assess the health risks associated with specific regions and adjust their operations accordingly. This may involve implementing additional safety measures, modifying in-flight services, or even temporarily suspending services to high-risk areas.  Implementing Safety Protocols: Data analytics supports the implementation of safety protocols such as enhanced cleaning procedures, social distancing measures, and health screenings. Airlines can analyze passenger data to identify potential hotspots and take proactive measures to prevent the spread of infections.  5. Geopolitical Unrest: Adapting Strategies:  Insights into Political Landscapes: Data analytics provides airlines with insights into geopolitical developments, helping them stay informed about changes in airspace restrictions, travel advisories, and potential risks. This information is crucial for adapting strategies in real time.  Proactive Route Planning: Airlines can use data analytics to proactively plan alternative routes in response to geopolitical unrest. This involves analyzing historical data, political trends, and intelligence reports to identify potential risks and optimize flight paths accordingly.  Real-time Monitoring: Real time monitoring of geopolitical events allows airlines to respond swiftly to sudden changes. This may involve rerouting flights, adjusting crew schedules, and communicating with passengers to ensure their safety and minimize disruptions. Business Continuity and Resilience  6. Proactive Resource Allocation:  Manpower Optimization: Airlines utilize data analytics to assess current and anticipated operational needs during a crisis. This includes evaluating factors such as flight schedules, passenger demand, and potential disruptions. Predictive modeling helps in forecasting staffing requirements, enabling airlines to allocate manpower efficiently. For example, if there’s an increase in demand for certain routes, airlines can adjust crew schedules accordingly.  Fuel Efficiency: Data analytics assists in optimizing fuel consumption by analyzing factors like aircraft performance, weather conditions, and flight paths. Airlines can adjust routes or implement fuel-efficient procedures to minimize costs during crises. Real time monitoring of fuel consumption allows for immediate adjustments, ensuring that fuel is utilized optimally based on current operational needs.  Supply Chain Management: During crises, supply chain disruptions can occur. Data analytics helps airlines monitor and manage the supply chain for essential components such as spare parts, catering supplies, and maintenance materials. Predictive models can identify potential risks to the supply chain, allowing airlines to make proactive decisions to secure critical resources and prevent operational disruptions.  7. Strategic Planning for the Future:  Scenario Planning: Airlines analyze data from past crises to develop various scenarios for future disruptions. This involves considering different factors such as the nature of the crisis, its impact on operations, and potential recovery timelines. Through scenario planning, airlines can create strategies that account for various contingencies, ensuring a more resilient and adaptable approach to future

Read More

Schedule a Demo