Visualizing data is the cornerstone of unlocking valuable and actionable insights from intricate information. In today’s data-rich landscape, dealing with raw data can be overwhelming and challenging to interpret. This is where Techmax Technologies stands out as your trusted ally. We recognize that the art of data visualization goes beyond crafting appealing charts and graphs; it’s about revealing the narratives concealed within the data. Our team of experts at Techmax specializes in crafting and implementing solutions that enable businesses to make well-informed decisions. By utilizing interactive dashboards and visual representations, we assist our clients in identifying patterns, recognizing opportunities, and uncovering essential insights that steer strategic growth. Whether it’s streamlining operations, enhancing customer engagement, or optimizing ROI, Techmax Technologies is here to harness the genuine potential of data visualization for your business triumph.
The Importance of Data Visualization
In our modern, data-centric environment, information serves as the driving force behind decision-making, and the ability to illustrate this information is the essential element for unlocking its full potential. However, what makes the visual representation of information so crucial in today’s corporate sphere?
1. Simplifying Complexity
We live in an era where data is continuously generated from various sources at an unprecedented pace. Large and complex datasets have become the norm rather than the exception. While these datasets contain valuable insights, they can also be overwhelming and difficult to decipher in their raw form. Data visualization steps in to simplify this complexity by translating intricate data into clear and understandable visual representations. These visuals allow decision-makers at all levels of an organization to grasp complex information quickly and make informed choices.
2. Enhancing Comprehension
Humans are inherently visual creatures. We process visual information much faster and more effectively than plain text or numbers. Data visualization leverages this innate ability, making it easier for individuals to comprehend data patterns, trends, and relationships. It transforms abstract data points into meaningful insights, enabling teams to collaborate effectively and align their efforts toward common goals.
3. Facilitating Communication
Data visualization serves as a universal language that transcends barriers. Whether you’re discussing financial metrics, marketing performance, or operational efficiency, visuals provide a common ground for communication. Charts, graphs, and interactive dashboards allow teams to present their findings coherently to stakeholders, fostering a shared understanding of the data and its implications.
4. Supporting Informed Decision-Making
In today’s fast-paced business environment, making informed decisions is paramount. Data visualization empowers decision-makers to analyze data quickly, identify trends, and respond to opportunities or challenges promptly. It guides organizations away from gut-based decisions towards evidence-based strategies, reducing risks and increasing the likelihood of success.
5. Competitive Advantage
Finally, data visualization isn’t just about keeping up with the competition; it’s about staying ahead. Businesses that harness the power of visualizing information gain a competitive edge by spotting emerging trends, optimizing processes, and adapting to changing market dynamics more swiftly.

The Role of Data Visualization
Data visualization is much more than a visual treat; it’s the bridge that transforms raw data into meaningful insights, empowering individuals and organizations to make informed decisions.
Translating Complexity into Clarity
One of the most significant challenges in the data-driven landscape is the sheer volume and complexity of information at our disposal. Raw data, often presented in spreadsheets or databases, can be overwhelming. It’s a sea of numbers, dates, and figures that can confound rather than clarify. This is where data visualization plays a pivotal role.
Through a combination of charts, graphs, heatmaps, and interactive dashboards, data visualization simplifies complexity. It distills intricate data sets into intuitive visual representations that anyone can understand. Patterns emerge, trends become apparent, and relationships are revealed. What was once a maze of data points is now a clear and navigable map, guiding decision-makers to their destination—actionable insights.
Beyond Aesthetics: Transforming Data into Insights
While aesthetically pleasing visuals are undoubtedly appealing, data visualization goes far beyond mere surface beauty. It’s about the substance within—the story the data tells. The true power of data visualization lies in its ability to turn data into insights that drive meaningful actions.
Through thoughtful design and strategic selection of visualization methods, data visualization unlocks the latent value within data. It answers critical questions, such as “What are our top-selling products?” or “Which marketing channel is most effective?” It enables decision-makers to delve deeper, asking “Why are sales declining in this region?” or “What factors are driving customer churn?”
By providing these answers, data visualization empowers organizations to identify opportunities, mitigate risks, and optimize their strategies. It transforms data from a passive resource into an active agent of change, driving improvements in operations, marketing, finance, and more.
In essence, data visualization is the catalyst for informed decision-making. It empowers individuals and teams to navigate the vast sea of data, extract meaningful insights, and steer their organizations toward success. As we delve deeper into the world of data visualization, we’ll explore how Techmax Technologies leverages these principles to create data-driven solutions that empower businesses to thrive in an increasingly complex and data-rich environment.
Techmax Technologies: Transforming Businesses through Data Visualization
At Techmax Technologies, we are not just in the business of data visualization; we are in the business of transformation. Our mission is to harness the immense power of data visualization to revolutionize the way businesses operate, make decisions, and thrive in today’s data-centric landscape.
Customized Solutions for Unique Challenges
We recognize that each business is as unique as the data it generates. That’s why we don’t offer one-size-fits-all solutions. Our approach is rooted in collaboration and customization. We work closely with our clients to understand their specific challenges, objectives, and industry nuances. Armed with this knowledge, we design data visualization solutions that are tailor-made to address their unique needs.
From Raw Data to Strategic Insights
Our team of data visualization experts possesses a deep understanding of the intricacies of data. We excel in transforming raw, complex data into clear, insightful visual representations. Our interactive dashboards are more than just aesthetically pleasing; they are intuitive tools that empower decision-makers to explore data, identify trends, and gain actionable insights.
Driving Growth, Enhancing Efficiency
Techmax Technologies isn’t just about making data look good; it’s about making data work for you. Our solutions go beyond surface-level improvements; they drive growth, enhance efficiency, and elevate performance. Whether it’s optimizing operations, enhancing customer engagement, or improving ROI, our data visualization solutions have a tangible impact on your bottom line.
The Finance 360 Success Story
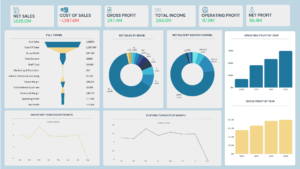
One prime example of our transformative approach is the Finance 360 dashboard. This dynamic and intuitive platform provides real-time insights into critical financial metrics, offering decision-makers unprecedented clarity into their financial health. Net Sales, Cost of Sales, Gross Profit, Total Income, Operating Profit, Net Profit—every crucial financial aspect is at your fingertips. With customizable Net Sales By Brand and Net Sales By Source Channel visuals, identifying top-performing segments has never been easier. The P & L Funnel offers an eagle-eye view of profit and loss trends while Operating Profit By Year and Gross Profit By Year charts enable historical performance analysis. The Inventory Turnover By Month and Debtors Turnover By Month visuals provide invaluable insights into inventory and receivables management. The Finance 360 dashboard is a testament to our commitment to delivering real, measurable results.

In essence, Techmax Technologies isn’t just a data visualization provider; we are your partner in transformation. We are committed to helping businesses navigate the complexities of the data-driven era and emerge not just informed but empowered. As we journey further into the world of data visualization, you’ll discover how Techmax Technologies continues to shape the future of business success through the power of data.


